This page contains a short overview on relevant data that you can find on the Raw Material Information System from the EU, as well as the Urban Mine Platform (section II) and further data sources (section III below) and their related research projects as basis and literature source.
An important remark: data is not equally actual for all these sources. While some have the latest data, some of the reports are based on older data (e.g. 2018) and are therefore “older” forecasts for all upcoming years shown in the diagams. Therefore, use these data carefully and critically.
I. Raw Material Information System (EU)
The website is an extensive repository of very diverse information related with critical materials in general, from country profiles to material profiles, through critical materials in the value chains of some RE system components and literature sources containing different reports on the topic.
The website contains extensive information on different materials, national and international flows and indexes for characterizing criticality (e.g. HHI-Index). You can navigate the dashboards for each material (e.g. for Cobalt see Fig.1), as well as e.g. the amount of material in the batteries clustered by application (Fig. 2).
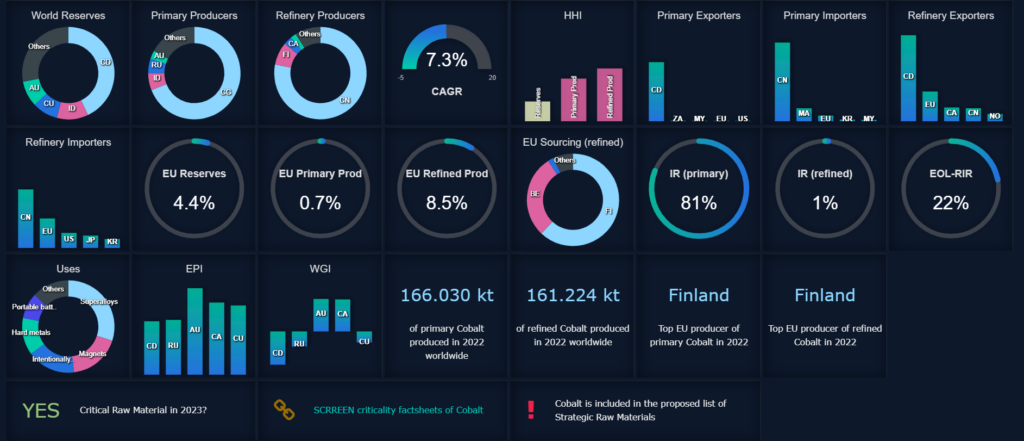
Fig. 1. Dashboard for Cobalt from RMIS portal.

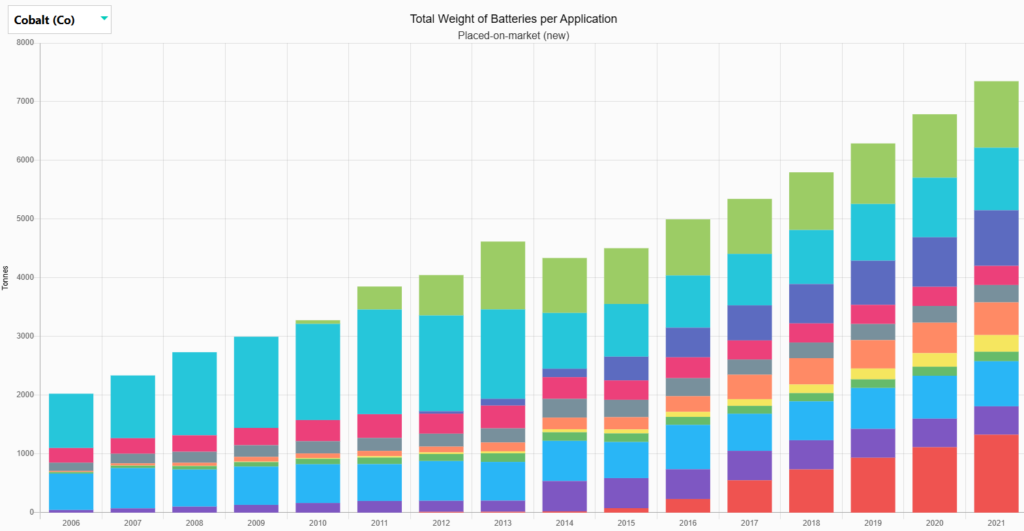
Fig. 2. PoM weight of Cobalt by battery application, from RMIS.
II. Urban Mine Platform (EU)
The urban mine platform contains extensive data from a multi- institutional and international research team (and project – FUTURAM) showing the amount of waste by sector/component and its possible variation under the scenarios of “recovery” and “circular” economy.
Fig a. shows the scope and methods used in the FUTURAM project to obtain the material and waste basis in the different scenarios (BaU, recovey and circularity).
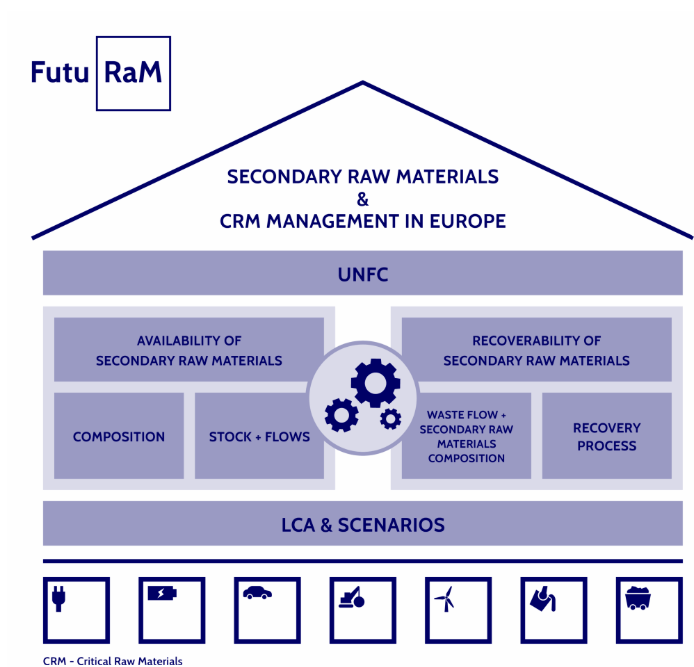
Fig a. scope and methods used in the FUTURAM project.
I let you here as an example two images of the ones which you can generate by selecting different data interactively in the website.
Navigating through its data you can find a good basis for the amount of batteries disposed under different scenarios by battery type (Fig b) or in general the amount of waste generated by different components under BaU case (Fig c).
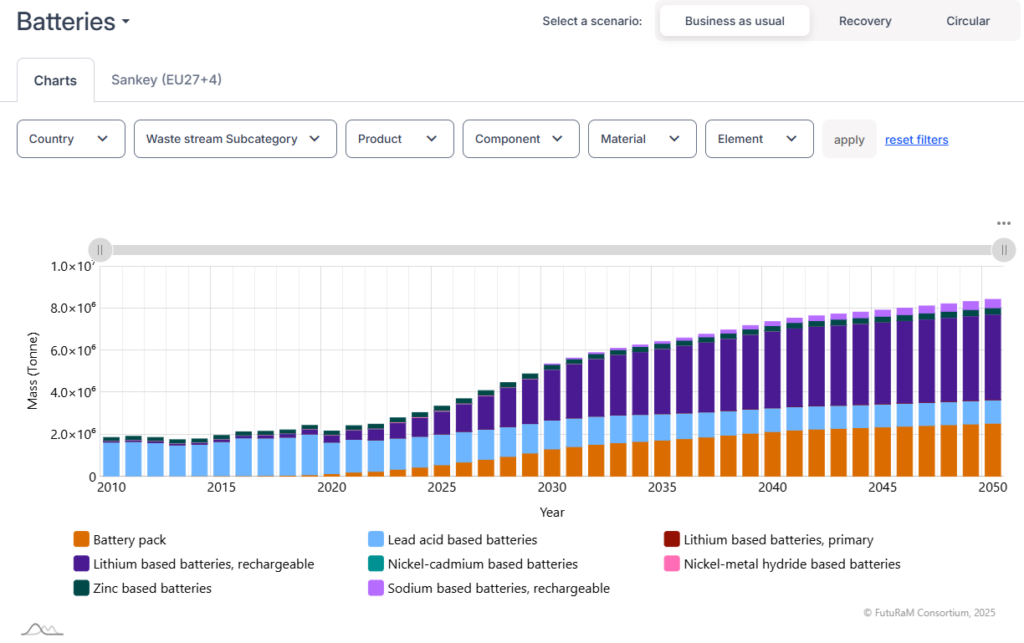
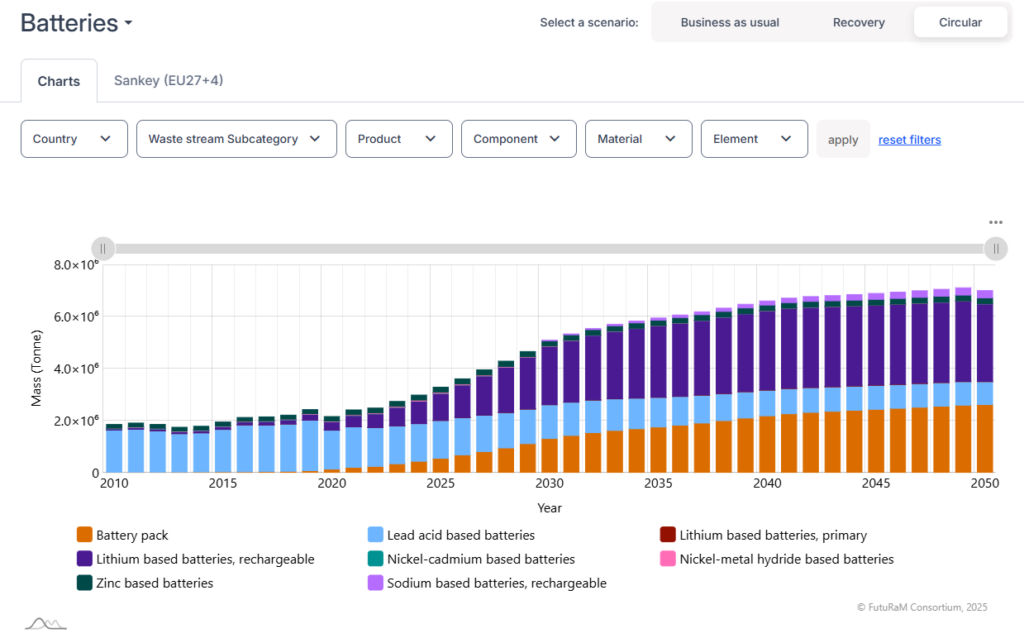
Fig b. Comparison of the waste flows from batteries of different chemistries under BaU and Circularity scenario assumptions
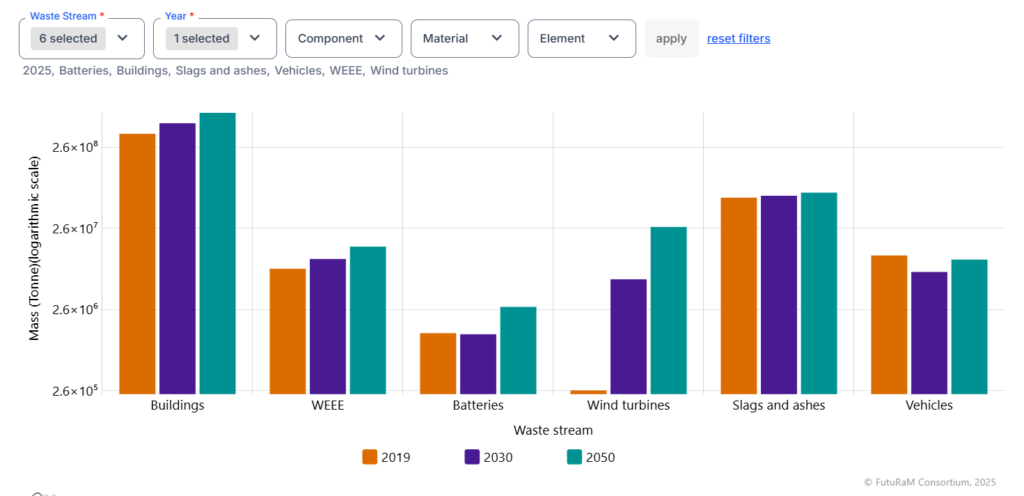
Fig c. Mass of waste (in logarithmic scale!) generated for different components in different years under BaU assumptions.
III. Data sources and relevant publications
- Urban Mine Platform
- Homepage – FutuRaM: project providing the data and scnearios for the Urban Mine Platform, with extensive sources explaining the data and assumptions.
- Link to the Raw Material Information System of the European Union
- Great source describing the methodology for critcality appraisal from the EU